

Everything looks healthy and the site is down. The pods are Running, the Deployment shows all replicas available, yet every so often the application stops answering HTTP requests and users see timeouts. Restarting the pod fixes it for a while, then it repeats, with no fatal error in the logs beforehand.
A recent forum post described exactly this and asked the question every on-call engineer eventually asks: what should I capture while it is happening, and how do I compare what Kubernetes reports with what a request actually experiences? That gap, between what the control plane says and what the user gets, is where the longest incidents live. This article is a proposed checklist; we have not run it against that reporter's cluster.
Why pods look healthy while requests hang
Kubernetes only knows what its probes tell it. A Running pod has a live main process, which says nothing about whether it can still serve a request. The causes that live in that gap:
- The probe checks the wrong thing. A static health route can pass while the real request path is blocked on an exhausted thread pool, a full database connection pool or a lock. The probe and request threads are not the same threads.
- Probe settings are too forgiving. With a ten second period, a three-failure threshold and a slow timeout, a hung pod can stay in the Service for half a minute or more.
- Throttling instead of a kill. A CPU limit that is too low makes a busy process crawl without restarting, so it looks alive but times out. Memory pressure near the limit can look similar before an OOM kill.
- Endpoints that are not what you think. Stale endpoints, a selector that matches an extra pod, or a Ready pod stuck behind a full conntrack table or a struggling node can produce hangs that depend on which backend a request lands on.
- Dependency stalls. If the app waits on DNS, a database or an outbound call with no timeout, request threads eventually block.
Layer one: capture evidence at the moment of failure
Solution label: Proposed architecture. Treat this as an investigation with a fixed evidence checklist, so the next occurrence leaves you with data instead of a restart. All of these are read-only:
kubectl get pods -n <ns> -o wide
kubectl get endpoints,endpointslices -n <ns> <service>
kubectl describe pod -n <ns> <pod>
kubectl top pod -n <ns> --containers
kubectl logs -n <ns> <pod> --since=15m
Then test from inside the cluster to separate the pod from the path in front of it:
kubectl run curl --rm -it --image=curlimages/curl -n <ns> -- curl -sv --max-time 5 http://<pod-ip>:<port>/
kubectl run curl2 --rm -it --image=curlimages/curl -n <ns> -- curl -sv --max-time 5 http://<service>.<ns>.svc/
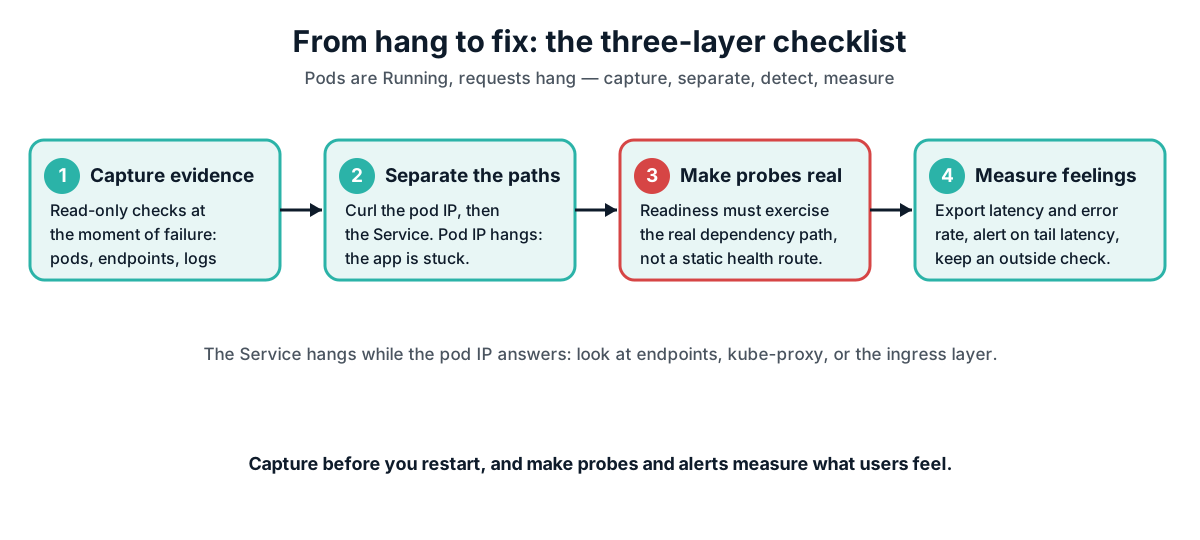
If the pod IP hangs, the application is stuck. If the pod IP answers and the Service hangs, look at endpoints, kube-proxy or the ingress layer. A debug container can show thread and socket state without changing the pod:
kubectl debug -it -n <ns> <pod> --image=busybox --target=<container>Layer two: make Kubernetes aware of real health
Give the application a readiness endpoint that exercises the real dependency path, with a short timeout. Keep liveness conservative, since a bad liveness probe restarts healthy pods under load. Add a startup probe so slow starts do not look like hangs. Review CPU limits and check throttling metrics.
Layer three: measure what users feel
Export request latency and error rate from the app or the ingress, alert on tail latency, and keep a synthetic check outside the cluster. The next incident then has a timeline: probes passing, latency climbing, when it began, and whether it correlates with a deploy or a node.
Probe, limit and timeout changes alter production behaviour. Roll them out through your normal change path, and confirm afterwards that tail latency, not just pod count, returned to normal.
Where Srenix fits
Srenix is an autonomous AI SRE for Kubernetes that runs inside your cluster as an operator, and this kind of incident is mostly a diagnosis job. It is in Beta with Design Partners. It has probes for endpoints, pending pods, node pressure and CrashLoopBackOff, and it can be triggered by Kubernetes events, Alertmanager alerts or webhooks. It can notice that a Service has endpoints that do not match healthy pods, that a node is under pressure, or that a workload has restarted in a pattern, and assemble that evidence into one finding you can read with kubectl get driftreports or in Slack.
Many findings are explained by plain rules with no AI. When a rule does not explain it, the model you choose, including an in-cluster endpoint, acts as the fallback.
On fixes, the limits matter. If the cause is application code, such as a thread pool deadlock or a missing client timeout, Srenix will not rewrite your software. If a safe, undoable action fits, such as deleting a failed pod or restarting a stuck ReplicaSet, it can propose that, and it runs on its own only if you enabled autonomy and allowed that action kind. Other proposals need a human to approve with a signed, single-use link in Slack. It re-runs the original detection afterwards and writes everything to a hash-chained audit trail.
Tradeoffs and failure modes
- Tighter probes can hurt. An aggressive readiness probe may pull healthy pods out of rotation under load.
- Capture needs to be fast. If the stall clears before you run the checks, you get no evidence, so automate collection where you can.
- Raising CPU limits treats throttling but costs money and may only move the bottleneck.
- A cluster-level cause such as conntrack exhaustion will not show in application logs.
How to validate
Acceptance criteria are targets, not measured results:
- A deliberately hung test pod is removed from the Service within the probe window.
- The capture commands produce a complete evidence bundle during a simulated stall.
- Tail-latency alerts fire before users report the problem.
- The pod-IP versus Service test correctly separates app faults from path faults.
Test plan: in a staging namespace, make a test app block its request threads while the health route still answers, run the checklist, and measure time to detection with the old and new probes.
The taking point
When pods look healthy and requests hang, capture before you restart, separate the pod from the path, and make Kubernetes and your alerts measure what users feel. Srenix is in Beta with Design Partners; you can learn more at reliora.ai and apply to the Design Partner programme there.